

Let's explore the key takeaways from Tableau Visionary, Sean Miller, who shares practical insights into how to leverage sets and set actions for dynamic data exploration.
Sets are essentially custom fields that define a subset of data based on specific conditions. These conditions can be static (pre-selected dimension members) or dynamic (based on aggregated measures or calculations). For example, you might want to know how much your top 10 customers account for as a percentage of your total sales. By creating a set, you can quickly isolate those customers and analyze their behavior across different categories or time periods.
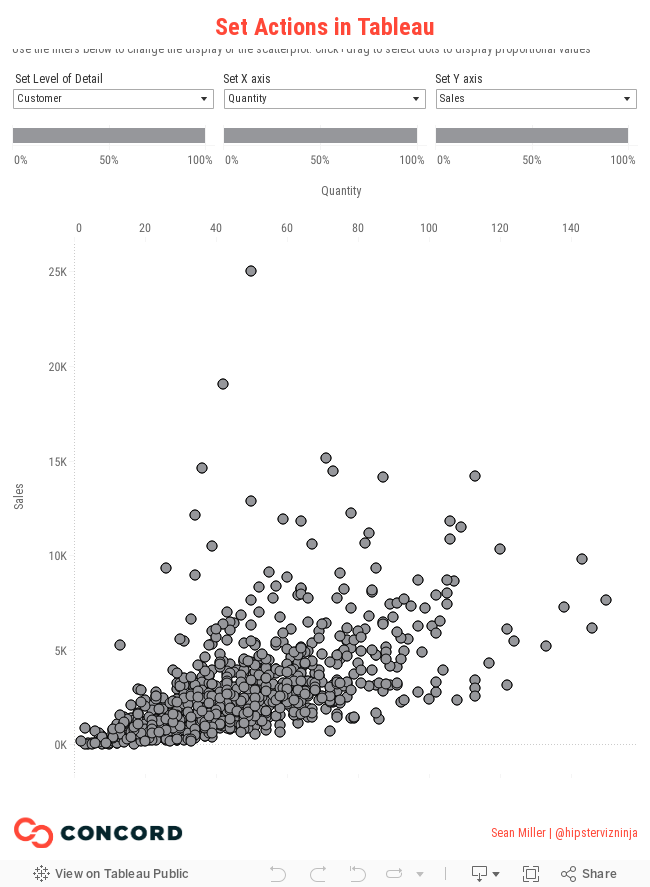
Sets can be manipulated interactively by leveraging Set Actions. This Tableau feature allows users to select dimension members dynamically and immediately see the results reflected in the visualization.
Imagine you’re analyzing customer sales data. With set actions, you can:
• Highlight your top 10 customers by sales.
• Split sales data by category, showing how the customer cohort performs within each category.
• Use conditional sets to focus on customers with sales over $1,000, automatically adjusting as the data updates.
One of the most important concepts to understand when using sets is the Tableau Order of Operations.

Sets are calculated before dimension filters, which can lead to different results depending on how your filters are applied. For instance, if you want to analyze data for a specific year, you may need to adjust the order of operations by adding your dimension filter to context to ensure that your set includes only customers from that year.
Set Actions give end users the ability to choose which customers or data points they want to focus on. This interactivity empowers users to dive deeper into the data without needing to adjust the underlying set manually.
For example, by adding a parameter to a set, users can specify whether they want to see the top 10, 20, or even 50 customers, making the analysis flexible and tailored to specific business questions. Sean also demonstrates how to use proportional brushing, allowing users to see how selected customers perform relative to the entire dataset.
Here’s a practical use case for Set Actions: Imagine you’re a sales manager looking to identify the performance of your top 10 customers in the Technology category over the last year. By creating a dynamic set that filters by date and customer sales, you can quickly visualize which customers contributed the most to your revenue.
You can even take this further by enabling users to add or remove customers from the set interactively, which opens the door to a much richer exploration of your sales data.
Tableau’s Set Actions are a powerful tool for creating interactive and dynamic visualizations. Whether you’re exploring top customers, filtering data by time periods, or creating custom sets based on specific conditions, this feature can significantly enhance your Tableau dashboards.
By understanding how to use sets and the Tableau Order of Operations, you can ensure that your analysis is accurate, relevant, and tailored to your business needs. Click here to learn more about Concord's Tableau practice and how we can help you leverage these advanced features to drive deeper insights and make more informed decisions.

Not sure on your next step? We'd love to hear about your business challenges. No pitch. No strings attached.


